Potentially Preventable Complications Report (PPCs)
Syntellis Axiom Software licenses software from 3M for classifying Potentially Preventable Complications. Clinical Analytics offers this logic as an add-on module; the output can be viewed in the Potentially Preventable Complications Report section in Clinical Analytics Scorecards.
For more information about PPCs, see Potentially Preventable Complications measures, or check out our Webinars page for a video recording explaining PPCs and PPRs (Potentially Preventable Readmissions); you can also download the presentation slides.
Scorecards PPC Section
The PPC Section is specifically designed to analyze 3M Potentially Preventable Complications and is available only to clients licensing 3M PPC Software through Syntellis Axiom Software. Contact Support for more information about adding this capability to your server.
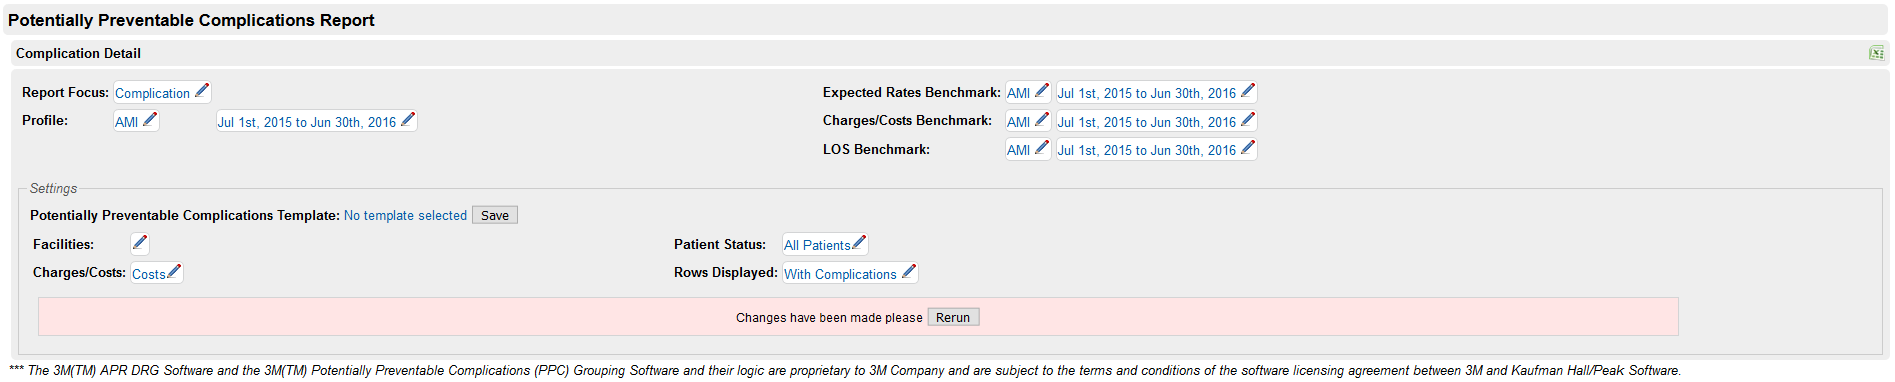
Analysis Parameters
You can set your analysis parameters at the top of the section. These selections are not saved in the Potentially Preventable Complications template, but can be changed at any time. Click the pencil icon next to the parameter to view the dropdown.
Report Focus
The first step of your PPC analysis is to select your initial Report Focus. These views are drillable and you can change this selection at any time.
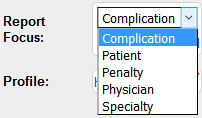
| Report focus | Intent | Group-By columns |
|---|---|---|
| Complications | This view groups patient incidents by the condition; each row is an aggregation of all encounters for a particular HAC, PSI, or PPC. | Complication |
| Patient | This view displays every patient encounter with an incident; each row is a patient encounter. This view provides details of the encounter, including the PPC-Adjusted APR-DRG (see below for more information), Costs/Charges and Length of Stay with the corresponding benchmark values. | Axiom Encounter ID, Attending Physician |
| Physician | This view groups incidents by Attending Physician; each row is an aggregation of all encounters with an incident for a particular physician. | Physician, Specialty |
| Specialty | This view groups incidents by the Specialty of the Attending Physician; each row is an aggregation of all encounters with an incident for all physicians with that particular physician specialty. | Specialty |
PPC-adjusted APR-DRG
The PPC-adjusted APR-DRG is calculated by the 3M PPC software. This is the APR-DRG (and SOI) that would have been assigned to the encounter had the complication not occurred. This value is the basis for the opportunity calculations because a patient with a complication is compared to similar patients that did not have the complication.
Profile
Select your profile and time period of interest from any of the internal profiles you have created in your scorecard.
Benchmark profiles
Complication Analysis is the only Scorecards section that allows you to select multiple benchmark profiles for one analysis. Select benchmark profiles for Expected Rates, Charges/Costs, and Length of Stay benchmark calculations. If you select an internal profile, you also have the option of the time frame for your comparisons.
Settings
NOTE: The applicable settings options vary slightly based on the Report Focus you select.
| Parameter | Description |
|---|---|
| Facilities | If you would like to filter by facility, select one or more facilities to be included; not selecting any facilities returns data for all facilities. |
| Charges/Costs | Select if you would like to see calculations by Charges or by Costs. |
| Patient Status | Select if you would like to see only Expired patients, only patients Discharged Alive, or All Patients. |
| Rows Displayed | Select if you would like to see Only Rows with Complications or All Rows (includes all patients, physicians, specialties, or complications, even if there were no incidents in the patient population). |
Report columns
In addition to the group-by columns previously listed, your report includes the following columns:
| Column name | Description |
|---|---|
| Observed # of Complications | The number of complications in the group. |
| Expected # of Complications | The expected number of complications for the group (calculated in the 3M software for PPCs). |
| Complication Variance | The difference between the Observed and Expected Chains; positive (marked red) values indicate more observed complications than expected. |
| Costs Opportunity - Total | The cost opportunity available if complications had been prevented. |
| LOS Opportunity - Total | The length of stay opportunity available if the complications had been prevented. |
